Introduction/Background
There has been plenty of research and evidence showing that stock prices can be predicted and are affected by various aspects of daily life, which can ultimately help an investor. For example, the general news occurring in the world and country can affect the movement of certain stocks directly and indirectly. However, much of the research in this field is centered around financial news, rather than the news as a whole. With this in mind, our team is looking to analyze the immediate change of stock prices as a reaction to general news. To better understand the difference between a stable stock and a more volatile entity, we will be using both Apple stock and Bitcoin prices for this project.
Problem Definition
This machine learning project focuses on analyzing news stories to predict the movement of Bitcoin (BTC) and Apple (AAPL) stock prices in the market. Research has shown that “inclusion of predictors [like] news articles and twitter posts can significantly improve the quality of stock price predictions” (Vanstone et al., 2019). For this midpoint, we focused on AAPL, and will extend to BTC moving forward. We do not expect this extension to take very long, as it would just require using BTC data instead of APPL data in our existing model. Instead of looking at purely apple-related or financial news, our model will be looking at news as a whole. Also, we shifted from simply predicting the rise and fall of AAPL to predicting the exact daily change in stock price. We are looking to find a correlation between the stock prices of AAPL and BTC and general news stories in the coming weeks to aid in investment decisions for both people and companies.
Data Collection
We obtained our news article data from the NYT Developer API, taking the NYT archive data from January 2016 to
December 2020. By feeding the month and year to the API, we get JSON with an array of all articles from that
particular month. Rather than the full raw text of all the articles, we receive the metadata from these articles
such as headlines, abstract, and keywords. Thus, the NYT data was already relatively clean and extensive data
cleaning wasn’t needed. It was helpful to use the cleaned data rather than raw text from all the articles to avoid
storage and computing issues in our model. To obtain AAPL data, we used the yfinance library to access historical
financial AAPL stock data from Yahoo Finance from December 2015 to January 2021 (we added these two extra months to
account for price changes from January 2016 to December 2020). Though this data was also relatively clean, we still
had to perform some data cleaning and preprocessing before our data was ready. For example, we added extra features
to the Apple data that were not present in Yfinance like the percent change for a day. We also removed the news
article data from days the stock market was not open, including weekends and holidays, to ensure our model was using
the appropriate data.
The content of interest in the NYT news articles was the abstract. We decided to use BERT because “it’s conceptually
simple” and “obtained new state of the art results on … NLP tasks” (Devlin et al., 2019). In order to semantically
and contextually represent the abstract using BERT, it underwent some pre-processing. The given abstract was treated
as a single segment of data. After adding the classifier and separator tokens, the abstract was tokenized using
built-in tensorflow extensions for BERT. Tokenization involves converting all words into BERT tokens, and split up
any OOV (Out-of-Vocabulary) words into smaller tokens, prefixes, and suffixes. After tokenizing the data, it was
converted to indices to represent each token as an entry in BERT vocabulary, which is the reference index for BERT
to get the unique word embedding for the given vocabulary word.
Methods
Once the news articles were cleaned, abstracts extracted, and their content pre-processed into BERT indices, they
were fed to an evaluative BERT model to get context-driven document embeddings. The input here was the pre-set word
embeddings provided by BERT without the fine-tuning corresponding to the indices obtained through pre-processing.
For the proof-of-concept purposes, the initial classification token from the 12th hidden layer was used as a
representation of the abstract, and the abstract itself was treated as a single, order-independent sentence. Getting
document embeddings for headlines involved conversion of pre-processed data into tensorflow sensors to feed the
evaluative model.
The classification-level document embedding for each abstract is a 768-dimension vector, thereby mapping the given
abstract to context-based semantic space as shown below.
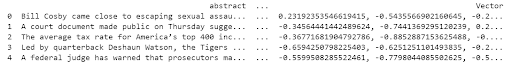
[Figure 1: A sample of abstract → vector mapping]
Here is a slice of our BERT vector document for a few of the news stories. In total, we have 69,404 of these vectors
where BERT has analyzed the language and mapped the data.
An LSTM network following the architecture shown below uses the context clues from document embedding of news
stories to predict the price increase or decrease due to the given news story. It is trained using the stock price
change as calculated from the data. This LSTM network uses neural networks to attempt to predict price increases. We
decided to use this model because recent research has shown that “the LSTM-based univariate model that uses one-week
prior data as input ... is the most accurate model.” (Mehtab et al., 2021)
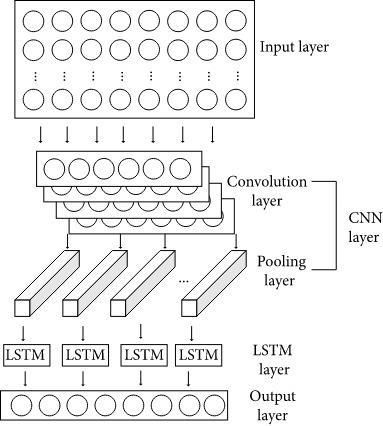
[Figure 2: Architecture of LSTM memory cell]
Our LSTM model follows the basic structure with three hidden layers each having 10, 20, and 30 dense units. We used
non-linear activation function ReLu(rectified linear unit) as our activation function.
Then we set the look back period as a 60 days; therefore, the model predicts the future price based on the four
features of past 60 days. The followings are the four features we consider for each day. We selected close price and
volume from the raw data, and added new parameters $\text{high close ratio}$ and $\text{percent change}$ so that the
model could capture the overall tendency well.
$$ \begin{cases} \text{close price} & \\ \text{volume} & \\ \text{high close ratio} &= \frac{\text{high price} - \text{close price}}{\text{close price}} \\ \text{percent change} &= \frac{\text{close price} - \text{open price}}{\text{close price}} \end{cases} $$
_________________________________________________________________
Layer (type)                 Output Shape              Param #
=================================================================
lstm (LSTM)                  (None, 60, 10)            600
_________________________________________________________________
dropout (Dropout)            (None, 60, 10)            0
_________________________________________________________________
lstm_1 (LSTM)                (None, 60, 20)            2480
_________________________________________________________________
dropout_1 (Dropout)          (None, 60, 20)            0
_________________________________________________________________
lstm_2 (LSTM)                (None, 30)                6120
_________________________________________________________________
dropout_2 (Dropout)          (None, 30)                0
_________________________________________________________________
dense (Dense)                (None, 1)                 31
=================================================================
Total params: 9,231
Trainable params: 9,231
Non-trainable params: 0
The 80 percent of the Apple stock data were used as the test data, and the model was trained by 10 epochs with batch size of 32. For the loss function, we used the mean squared error.
$$ MSE = \frac{1}{n} \sum_{i = 1}^{n}(Y_i - \hat{Y_i})^2 $$
_________________________________________________________________
Epoch 1/10
31/31 [==============================] - 13s 253ms/step - loss: 0.0773
Epoch 2/10
31/31 [==============================] - 8s 250ms/step - loss: 0.0200
Epoch 3/10
31/31 [==============================] - 8s 253ms/step - loss: 0.0141
Epoch 4/10
31/31 [==============================] - 8s 252ms/step - loss: 0.0102
Epoch 5/10
31/31 [==============================] - 8s 247ms/step - loss: 0.0083
Epoch 6/10
31/31 [==============================] - 8s 251ms/step - loss: 0.0085
Epoch 7/10
31/31 [==============================] - 8s 246ms/step - loss: 0.0078
Epoch 8/10
31/31 [==============================] - 8s 250ms/step - loss: 0.0074
Epoch 9/10
31/31 [==============================] - 8s 259ms/step - loss: 0.0066
Epoch 10/10
31/31 [==============================] - 8s 250ms/step - loss: 0.0066
Results and Discussion
To summarize our results so far, we have collected news article data from the NYT developer API and stock price data from the yfinance library. We preprocessed the data by adding certain features like moving averages and daily change ratios to the Apple stock price. Then we analyzed the News Article data and organized the information into JSON files with information like abstracts, headlines, sources, and publication dates. After performing an analysis of the data, we reduced the number of dimensions by removing unnecessary features like the author, captions, url, and images to name a few. Then we created a LSTM model with neural networks for the Apple Price data using tensorflow and scikit that predicts Apple price data with an accuracy of 67%. For now we only have data on Apple but it’s very simple to query for other stock prices and rerun our model on the newly trained data. We also ran our BERT model on the New York Times articles and vectorized all 60,000 plus stories. Next our goal is to train the LSTM model on this data and see how much better the prediction becomes.
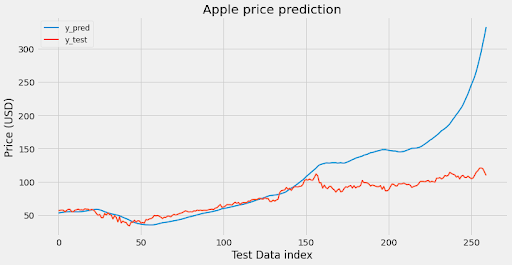
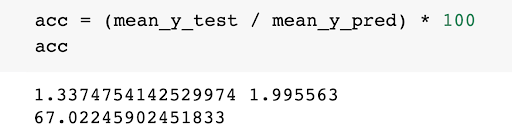
Analyzing this data found that the accuracy is about 67%. Next we’re planning on training our model with the BERT
tokens and seeing the new accuracy when we utilize context and sentiment in our program.
We will be adding the prices of Bitcoin (BTC) over time to our model as well, to better represent how a more
volatile entity (compared to AAPL) responds to the news cycle. This data will require a lot of cleaning, as BTC has
increased exponentially over time but we are looking to isolate the growth BTC has had due solely to general news.
Pooling is an important factor rather ignored in the present approach. One of the major ways to improve accuracy by
finding contextual relevance between news stories and stock prices is by generating more meaningful document
embeddings by experimenting with various types of pooling between output embeddings for abstracts to find an
approach that maximizes accuracy by accounting for outputs across words, layers, and sentence-based partitions
spanning across multiple model-based outputs. Similarly, once we do have a document embedding the target price can
drastically change based on the type of pooling used on all articles of the same day, determining the final price.
The approach to pool prediction by news story for all articles published in a day could significantly improve the
performance of the neural network. Another area of improvement is fine-tuning. When BERT is fine tuned to specialize
in news articles, it eliminates more noise, conveying more relevant information in the document embeddings
generated. Finally, predictions could increase through reinforcement learning, where the price change due to a given
news article is an input to a reward function, and the news articles in the past few days affect the stock price
change, instead of just the last business day. As a result, more complicated and long-term stories with evolving
timelines could be better represented in the stock price prediction, thereby improving the prediction accuracy
through greater comprehensivity.
References
- Devlin, J., Chang, M.-W., Lee, K., & Toutanova, K. (2019, May 24). BERT: Pre-training of Deep Bidirectional Transformers for Language Understanding. arXiv.org. https://arxiv.org/abs/1810.04805?source=post_page.
- Mehtab, S., Sen, J., & Dutta, A. (2021). Stock Price Prediction Using Machine Learning and LSTM-Based Deep Learning Models. Communications in Computer and Information Science, 88–106. https://doi.org/10.1007/978-981-16-0419-5_8
- Vanstone, B. J., Gepp, A., & Harris, G. (2019). Do news and sentiment play a role in stock price prediction? Applied Intelligence, 49(11), 3815–3820. https://doi.org/10.1007/s10489-019-01458-9